Archive | safety RSS feed for this section

Today in Ipswich

5 Jan

Today (Thursday  5 Jan 2017) in Ipswich, and it’s only 10:30am.

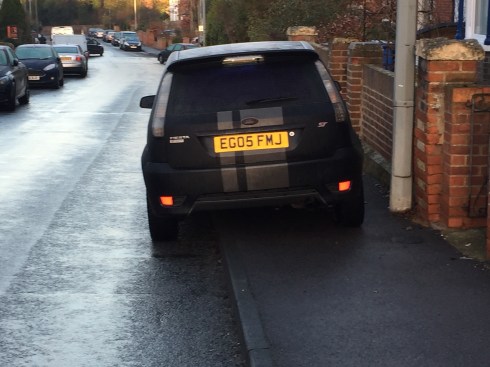
First off, I pass this vehicle on St John’s Hill in Ipswich. How can this possibly be not classed as obstruction?  It is happens regularly here, and I have reported it to the police , but it still continues.

img_8589

A mins further on and I spot this van, car and wheelie bin making life for pedestrians very difficult on St Helen’s Street outside H & F Autos.img_8590

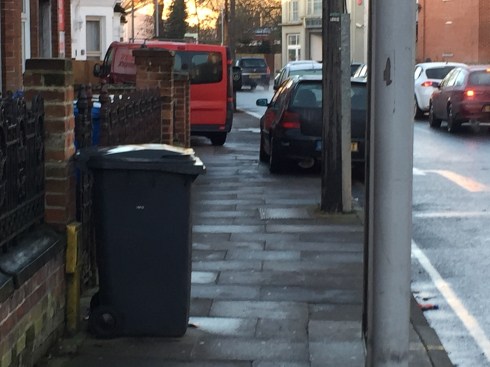
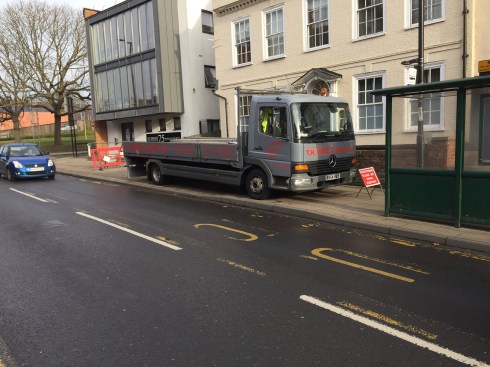
Then onto Grimwade Street and the pavement next to a bus stop is completely blocked  by this scaffolding lorry for the third day running. For sure, these guys need to unload safely and get a complex load of scaffolding installed, but do they need to bock the pavement like this? Are they allowed to? If so then should they have applied for permission? And have they done it safely and properly? In reality pedestrians walk past the sign rather than risking their lives crossing a busy fast one-way street at the suggested location.

I spoke to the company and the MD told me that he believes that no permission is needed to do this.

img_8593-1

Checking some legislation, the ‘New Roads and Street Works Act 1991’ may be applicable. However, it says that one should not “create an obstruction in a street to a greater extent or for a longer period than is reasonably necessary, the street authority may by notice require him to take such reasonable steps as are specified in the notice to mitigate or discontinue the obstruction“. (section 66) which implies that they should have asked to permission. I will do some more digging.

img_8583

Pop round the corner onto Fore Street, opposite the university, and we find UPS well up on the pavement. Notice the ‘no waiting’ ticks on the pavement.

ups

Update (Friday 6 Jan 2017)

I was pleased to see that today the scaffolders have replaced the ‘pedestrians cross the road’ sign with a ‘warning men working overhead’ which is much more appropriate.

BBC totally ignore pedestrians in program on car crashes again..

13 Nov

The BBC recently showed a documentary, Impact, A horizon guide to car crashes without even mentioning pedestrians or cyclists, or anyone else not in a car, which is a shame considering that almost 30% of all people killed on the roads these days are not in cars (In 2011 there were 453 pedestrian and 111 cyclist deaths out of a total of 1,901 people killed on GB roads). This isn’t even the first time it has happened. In 2011 the BBC showed a program titled ‘surviving a car crash’, which also failed to even make a passing nod to the dead and injured pedestrians and cyclists.

Please complain to the BBC about the program which was last shown on BBC4 on October 24. Here is the text I used, which you are free to adapt as you see fit:

“The BBC has again aired a program about car crashes and technological changes to make vehicles safer without mentioning once that pedestrians or cyclists also get killed. The program is called ‘Impact, A horizon guide to car crashes’ (http://www.bbc.co.uk/programmes/b03f438q) For the record, in 2011, of the 1901 people killed on the road in GB almost 30% were not in a vehicle, (453 were pedestrians and 111 were cyclists). Regrettably, this isn’t even the first time the BBC has done this. Back in 2011 you did the same with ‘surviving a car crash’. (http://www.bbc.co.uk/programmes/b00ylxg8)

“Please can you prepare and air a documentary focused on the work being done (and not being done) to help vulnerable road users and ensure that pedestrians and cyclists at least get a mention in any program about vehicle safety. Incidentally, are you aware that  cars with pedestrian ratings of zero are still allowed to be sold in this country. (http://www.standard.co.uk/news/cars-fail-in-pedestrian-safety-tests-6327782.html)

New campaign aims to reduce danger to pedestrians and cyclists from trucks

5 Feb

See Me Save Me is a new campaign to make HGVs safer and reduce the shocking levels of injury inflicted by them on vulnerable road users, particularly on cyclists but also pedestrians. The campaign is pressing for better design of trucks, improved on-vehicle safety technology and better design of junctions.

Only 5% of vehicles on the road in the UK are HGVs but they are involved in about 50% of cyclist deaths. The number of cyclists killed on UK roads has risen in each of the past three years

See Me Save Me

The casualties of war

17 Nov

This is one of saddest maps I have ever studied. It is an online slippy map showing where people died in  traffic collisions – every single square represents someone who didn’t come home one day over the past 10 years. Here are some screen-grabs. The first image is for the West Midlands area; the blue square indicate where people were killed in traffic crashes while walking, the green ones for people cycling, the orange ones for people on motorbikes and the purple ones for vehicle occupants. The second image gives a more detailed view. Notice the 1 year old girl, the 12 year old boy, the 20 year old young woman and all the others. Do try it for yourself and see what the war likes around where you live. When is this civil war (between motorcars and people) going to be brought to a close and who will ensure that it happens? Possibly for starters we should take a moment to grieve on Sunday along with thousands of other people around the world on World Day of Remembrance for Road Traffic Victims. See below for places where services are being held in memory in the UK.

Road fatalities in the West Midlands 2000-2010

Fatalities and injuries in the Birmingham area – detail

Services are being held in these places on Sunday 20th November 2011:

Aberdeen, Kings College Chapel, 3pm Contact: June Ross 07595 904360
Ashburton, St Andrew’s Church, 2.30pm Contact: Jeff Baker 01392 435627
Bath, Chapel Arts Centre, 3pm Contact: Sandra Green 01275 399025
Brecon, Brecon Cathedral, 3:30pm Contact: Cathedral: 01874 623857
Cambridge, St Luke’s Church, 3.30pm Contact: Rev Lance Stone 01223 351174
Carlisle, Carlisle Cathedral, 3pm Contact: Rev Mark Boyling 01228 523335
Chichester, Chichester Cathedral, 3:30pm Contact: Paul Foster 0781 069 7781
Gloucester, Gloucester Cathedral, 3pm Contact: Canon Celia Thomson 01452 415824
Hailsham, St Peter & St Pauls Church, 3pm Contact: Gill Powell 01323 847714
Halifax, Piece Hall, 3pm Contact: David Short 01422 392142
Hereford, Hereford Cathedral, 3:30pm Contact: Jackie Boys 01432 373311
Hull, St Mary’s The Virgin, Lowgate, 2pm Contact: Rev Michael Hills 01482 214551
Kidderminster, St Ambrose R.C. Church, 6.30pm Contact: Christine Sollom 01299 832581
Leeds, Leeds Parish Church, 3pm Contact: Carole Whittingham 0845 1235541
Lincoln, Central Methodist Church, 3pm Contact: Simon 01522 504 0711
Liverpool, St John’s Gardens, 1pm Contact: Pauline Fielding 01513 426381
Liverpool, Parish Church of Our Lady and St Nicholas, 3pm Contact: Pauline Fielding 01513 426381
London, St James’s Church, Piccadilly, 2:30pm Contact: RoadPeace Office 020 7733 1603
Northampton, Holy Sepulchre, 3pm Contact: Chris & Nicole Taylor 01604 705171
Norwich, R.C. Cathedral of St John the Baptist, 3.30pm Contact: Bridget Wall 01366 382433
Preston, Christ Church Precinct, 11am Contact: Maria Hodgson 01772 720279
Ripon, Ripon Cathedral, 3pm Contact: Rev Keith Jukes 01765 603462
Sheffield, Upper Chapel, Unitarian Church, 6.30pm Contact: Rev David Shaw 0114 272 5338
Thame, St Mary the Virgin Church, 3pm Contact: Elizabeth Richardson 01189 231802
Worksop, St John’s Church, 3pm Contact: Mrs A Moat 01909 472324

Credits

Casualties: Stats19 as deposited by the DfT. © Crown Copyright.

Maps by ITO World Ltd. Base mapping © MapQuest 2011. Map data © OpenStreetMap and contributors CC-BY-SA

20 mph proposals in Edinburgh and road safety

13 Nov

Edinburgh is proposing a significant increase in the number of streets covered by 20mph. This is being promoted as a way to encourage waking and cycling and to improve road safety. It has been reported that they also support the scheme because ‘lower speeds make people feel safer when they are walking and cycling and make streets better places to live’. I am very supportive of 20mph zones, I live in one myself, and they do indeed help make streets feel less intimidating. However.. it is also very clear that 30 mph speed limits are being retained on the roads where most people are getting injured.

Here are three maps to show the compromises being taken between road safety and ‘keeping traffic moving’. The first map shows the proposed streets to be 20 mph (green and yellow) and 30 mph (blue). The second map shows where people have been injured between 2000 and 2010 by mode (blue for pedestrian, red for cyclists, tan/green for vehicle occupant). The final map shows these two superimposed illustrating that very few crashes from the past 10 years have actually occurred on the roads included on the scheme. (Click on maps for full size versions)

Existing 20 mph zones (green) and proposed schemes (yellow)

Location of traffic casualties by mode in Edinburgh 2000-2010

Overlay, traffic casualties 2000-2010 on top of proposed speed limits

One realistic approach for now might be to welcome the introduction of these 20 mph limits in residential areas and also to also press for average speed camera checks on the remaining arterial roads enforcing the 30 mph limit as they have just installed in part of Plymouth.

Mapping pedestrian/cyclist road casualties by age

12 Nov

The Stats19 casualty data that the police have been patiently collecting for many years now is a mine of information. Here are some maps looking at where pedestrians and cyclists are injured and killed depending on their ages. I have taken three places which show up some patterns which deserve more analysis (London, Edinburgh and Northampton). There are some obvious patterns, in that children are hurt in the residential areas, 16-55 year olds tend to be injured in the commercial centres and along the main arterial roads whereas 55+ year olds have their own distinct patterns. However, it is also possible to see tell-tail clusters which deserve more investigation, including the apparent rat-runs along ‘residential’ roads that have much higher levels of injury than surrounding roads, and also the junctions and sections roads where higher numbers of casualties that surrounding ones. Click on the maps to make them bigger and see what you can find.

South London pedestrian and cyclist casualties by age 2000-2010

Edinburgh pedestrian and cyclist casualties by age 2000-2010

Northampton pedestrian and cyclist casualties by age 2000-2010

Lots more mapping coming up on the lead up to World Remembrance Day for Road Traffic Victims on the 20th Nov.

Rembering the dead on London’s roads

12 Nov

Thank you to the hundreds of cyclists who took part in the Tour du danger today to highlight a number of London’s most dangerous junctions and put pressure on the Mayor and on TfL to do some serious work on them.

Here are some maps showing where people are have been getting killed and injured in recent years. The first one shows deaths and injuries from traffic crashes between 2000 and 2010, the second for 2010 only and the next one for 2009 and the final one for 2000. Areas of blue indicate were pedestrians are getting injured and killed, red shows the high risk areas for cyclists. Purple is for motorcyclists and tan/green for vehicle occupants. Click on the images to see them full size.

Road casualties in Central London 2000-2010

Road casualties in Central London 2010

Road casualties in Central London 2009

Road Casualties in Central London 2000

These maps appear to show that fatalities amongst vehicle occupants has fallen from 17 in 2000 to one in 2009 and then zero in 2010. For cyclists the trend is apparently going the other way (up from four in 2000 to eight in 2009 and also in 2010). Motorcyclist fatalities are up from 0 in 2000 to 6 in 2010, pedestrians falling significantly. Do however be aware that this map only shows one fatality blob for crashes with multiple fatalities (which may include multiple modes). I will do some more work on this in the coming week and the figures may then need to be adjusted upwards.

Based on Stats19 road casualty data. See ‘Reported Road Casualties Great Britain‘ for more details.

Ipswich Borough Council blocking pavements with roadworks signage

17 Oct

Ipswich Borough Council staff are disrupting pedestrians near to road works by leaving signs on pavement with only 800mm clearance (which is about the width of an external door to a house and less than the legally required 1 meter for road works signs). Only when pressed did they confirm that they knew the law about 1 meter clearance. Their justification was that they were concerned about the risk to motorists if the signs were further into the road – no concern at all that I heard about the risk to pedestrians and old people from leaving them on the pavement. I have reported this on fixmystreet which the council monitors and responds to.

Here are some photos of the signs in question. The good news is that there is a 100% clear rule that they are breaking in this case. No excuses about it being a ‘necessary obstruction’ or a ‘willful obstruction’. It is however a very clear example of the contempt that pedestrians are treated with and is, I am sure, repeated across the country. Incidentally I am still waiting for May Gurney to ask for their signs backwhich they left blocking a pavement over a week ago!

Only 800mm for pedestrians

Only 800mm for pedestrians

Making the pavement even narrower (less than the legal 1 meter as well)

Making the pavement even narrower (less than the legal 1 meter as well)

Blocking the pavement illegally and useless due to parked car!

Blocking the pavement illegally and useless due to parked car!

Damaged sign, no sandbag, on pavment across dropped kerb by local shop

Vehicle sign blocks access to pedestrian walkway for disabled

Update

The following day all consideration of pedestrians had disappeared.

No consideration for pedestrians at all the next day

Where do people die on urban roads?

30 Sep

Caroline Russell from Islington Living Streets left a comment on my last post highlighting the fact that people get killed and seriously injured on artery roads, not on the residential roads where 20 mph speed limits are to be promoted by the government. Personally I think 20 mph limit area for residential roads are great and reduce the level of intimidation or pedestrians, I live in one. I am however also aware that people do indeed get killed and seriously injured on the arterial roads. Here is a map showing all killed and seriously injured in the period 2000-2008 inclusive for part of Islington/Hackney showing that injuries and deaths do indeed occur on arterial roads.

Killed and Seriously injured – Islington and Hackney. 2000-2008

Here is a map for a larger area – notice how the arterial road network is visible even at this scale solely from the location of traffic casualties. click to open the image at full resolution.

Killed and Seriously injured – North London. 2000-2008

And here is one for most of north London. Again the arterial road network can be identified very easily. Click to open the image at full resolution.

Killed and seriously injured – Greater London. 2000-2008

Mapping using Stats19 police data for casualties, OpenStreetMap for the rail and rail networks and OS Boundary-Line for boundaries. Maps created using ITO Map (pre-release version). All maps cc-by-sa 3.0.

Making urban roads safer for pedestrians

29 Sep

Philip Hammond has explained today that he wants us to drive faster on motorways in order to create a ‘healthy economy‘, ‘generate hundreds of millions of pounds of economic benefit‘ and ‘put Britain back in the fast lane of global economies‘. This proposal was evidently resisted by the Health Secretary and the Energy Secretary for obvious reasons and the RAC Foundation estimates that driving 10 mph faster increases fuel use and CO2 emissions by more than 20%; the AA have reported that we are actually driving more slowly now in response to increased fuel costs. Hammond says it won’t increase road casualties – others disagree. I think this whole proposal is rather unhelpful and may well back-fire on the government. However…

My main interest here is on the needs of the pedestrian and Philip Hammond also promised a big expansion of 20 mph speed limit zones in urban areas where nearly all of the 403 pedestrian road fatalities, 5,000 serious injuries and 20,000 slight pedestrian injuries occurred during 2010; 42% of all road fatalities also occurred in urban areas. We need to continually remind people of the scale of the road safety problem in our country and press for these 20 mph limits in residential areas which have proved to be very effective.

Here are a couple of maps showing the scale of our road safety problem. The first map shows the locations of all pedestrian deaths (red dots), serious injuries (purple dots) and slight injuries (blue dots) on GB roads between 2000 and 2008; other road deaths and serious injuries are shown using lighter grey dots. The boundaries are parliamentary constituencies. Click on the map to enlarge.

GB pedestrian casualties 2000-2008

This second map shows all road fatalities (red), serious injuries (purple) and slight injuries (blue) for 2008 when 2,500 people died and 26,000 were seriously injured.

GB road casualties 2008

Since 2005 the United Nations has supported the inspiring World Remembrance Day for Road Traffic Victims which is an opportunity to reflect and remember those killed on our roads. It takes place this year on 20th November with services across the UK and all round the world. Why not ensure that a suitable remembrance service is held near where you live this year?

Mapping uses Stats19 police data and Ordnance Survey Boundary-Line data. Mapping created using ITO Map (pre-release version). Both maps available cc-by-sa 3.0.