Archive | statistics RSS feed for this section

Interesting transport trends

16 Jul

Here are a bunch of recent motoring and transport trends based on published government data that build up a picture that despite having to cope with more and more vehicles cluttering up our lives, they are being used less and less and younger adults turning away from cars in very significant numbers.

Notice how the slope of this first graph reduces after 2005. Even with this reduction the number of vehicles on our roads has increased by a remarkable 8 million units between 1994 and 2013. No wonder it is hurting!

Registered vehicles on GB roads

The population has of course also been rising fast and this graph shows the ratio of cars to population which leveled off at 45-46% in 2005. This is one of the indicators that lead an increasing number of academics to suggest that something significant is changing in our relationship to car ownership who are now looking carefully to see if this as a ‘pause’ to be followed by renewed growth, a ‘saturation’ which will now be maintained, or a peak that will  be followed by a decline.

registered cars per head of GB population

This next chart shows the number of cars registered for the first time each year, most of then new vehicles coming into the fleet. This peaked in 2002 and 2003 with 2.5 million vehicles added in each of those years, with a low in 2011 of about 1.7 million before renewed growth recently with 2 million units sold in 2013.

New car registrations by year for GB

Needless to say, the size of the fleet is also linked to the number of cars scrapped or otherwise removed from use each year. This next chart shows the change in the number of cars on GB roads having accounted for these scrapped vehicles. This also shows the reduction in the rate of growth since 2006 but the number of vehicles has increased in each year including the 418,000 added last year. Ouch!

Change in number of registered cars on GB roads

It is also worth looking at the age of the fleet given that the above graph indicates that people are not scrapping cars at the same rate as they are buying new ones. This next chart below is my estimate of how old the oldest cars would be if car were all kept for a uniform time before being scrapped. Although this not hugely accurate it is probably good enough for our purposes. What is shows is that we now appear to be keeping our vehicles for four years longer than we did until 2005. This does fits with my experience. We have a pretty old car and it still looks very shiny and hasn’t let us down. No sign of the rust that used to finish off earlier models.

average age of GB car fleet

Even with all these cars, we are actually driving less miles each year, with average vehicle utilisation falling by 20% since 1994 from a bit over 10,000 miles per year per car in 1994 to 8,000.

Miles driven per car per year on GB roads

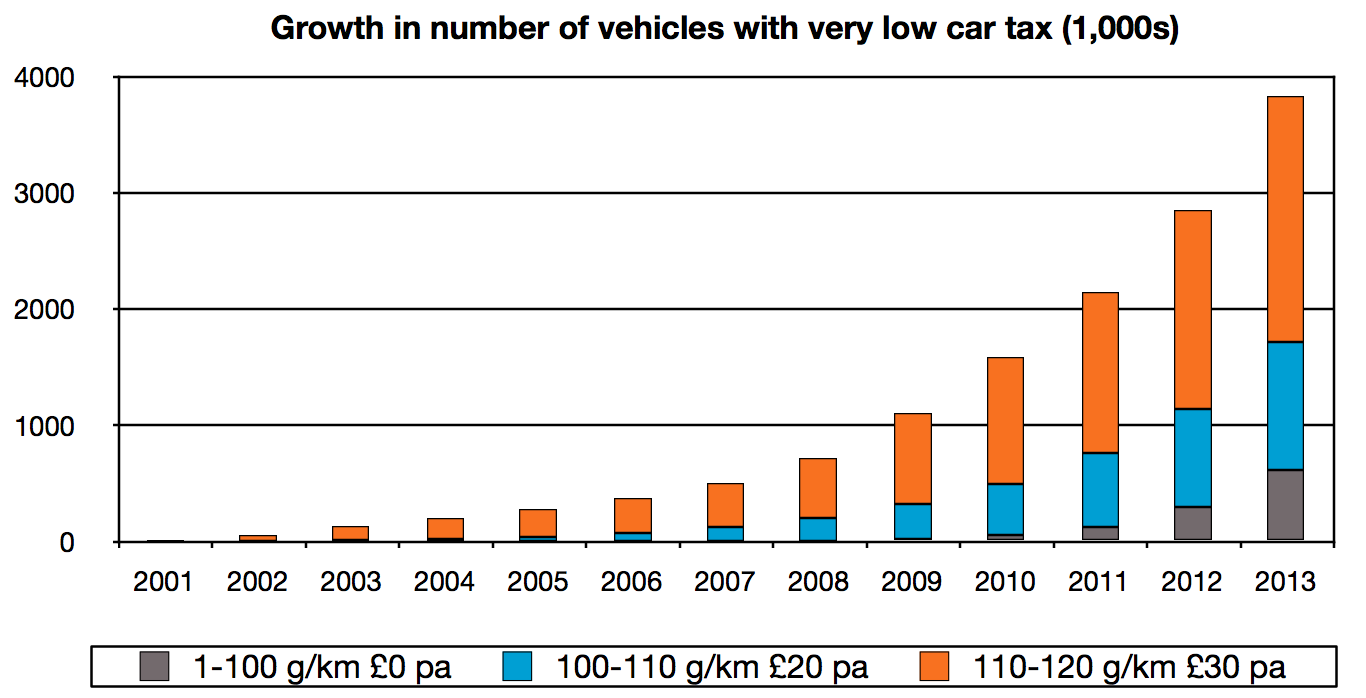
Another trend over the past 10 years has been the growing number of vehicles that pay next to nothing in car tax from virtually none in 2001 to 4 million last year. This low tax band has encouraged people to buy cars with low emissions for sure, but has also created a significant fleet of cars which cost less to tax for a year than to fill up with fuel!

Growth in number of vehicles with very low car tax

Finally, here is evidence that young adults are just not getting into the driving habit in the way that they did only recently. The number of 17 year olds who learn to drive has dropped 24%, (or 46,000 people) over the past six year. The only group where there is a noticeable increase has been women between 30 and 35, but that is no where  near enough to compensate for the earlier reductions. Academics are now watching carefully to see if this is simply that 17-20 yer olds are delaying for a few years and will learn to drive a few years later, or if a significant number will lead their lives without ever gaining a driving license.

Change in number of driving test passes 2013 v 2007

Zipcar did this interesting research into young adults attitudes to motoring. Parliament published a briefing paper in 2013 looking at the possibility of Peak Car use in Britain and Professor Phil Goodwin has produced this very approachable introduction on these changes. In the mean time I will leave you with a spokesman from the Society of Motor Manufacturers saying how delighted the industry is with all the new cars that they are selling at the moment, many of which will end up on our pavements!


Injustice to motorists, my foot!

20 Mar

The RAC Foundation complained today that motorists pay £32 billion in taxation each year but only get a ‘paltry’ £10 billion spent on road-building.

OK, so what if they had remembered to include the £8 billion ‘cost’ per year for road fatalities (Audit Commission, 2008), the £8-20 billion ‘cost’ of  the 50,000 early deaths caused by air pollution, much of it caused by road traffic (Commons Environmental Audit Committee, 2010 ) and the £7 billion negative effects of the emission of 90 million tonnes of CO2 emissions per year (DfT National Transport Model Road Forecasts 2011, page 52, at an estimated cost of £70 per tonne (Social cost of carbon OECD)? Include those and the direct measurable costs of motoring have reached £33 – 45 billion comfortably exceeds what motorists pay, even without considering of noise pollution, loss of amenity and military campaigns aimed at protecting access to fossil fuels!

Also, why does one have to keep on reminding these organisations that taxation is expected to cover more than the direct consequences of the activity? Not doing so is like a gambler complaining that it is unfair that taxation from gambling brings in more money that is spent on the negative social to families and communities of gambling addiction, or a drinker/ smoker complaining that taxation exceeds the negative effects to society and family of their activity. Check out the great campaign, iPaxRoadTax for a history lesson in how motorists have been pleading for special tax treatment since Winston Churchill ended the Road Fund in 1937!

Where are the electric cars?

21 Nov

Where are all the electric cars? According to the latest RAC Foundation report, Keeping the nation moving, the government wants us to have 1.7 million of the things on the road by 2020 to be on track to meet our carbon reduction targets. Unfortunately only 106 people bought one in the last quarter even with a very generous £5,000 sweetener against each purchase – a total of 940 electric cars have been sold in 2011 (in and out of the scheme). At this rate it will take another 1,700 years until we meet the government’s 2020 target. Possibly that is why the RAC Foundation recommends that we should rely on petrol cars for a little longer (page 33) and should build more roads (because petrol cars are so inefficient when stuck in traffic). (page 34)

Unlike the RAC I am more interested in car clubs which had 161,000 members in the UK by January 2011, up from 112,298 members the year before. That is 161,000 people sharing only 3,055 cars between them, no wonder the motor industry isn’t that keen. Car club members tend to only use cars for the odd journey and are much more likely to walk, cycle and use public transport for everyday journeys reducing congestion and pollution for everyone and also the need to build roads. So, no wonder that the road builders aren’t keen.

The really interesting thing about car club membership however is the demographic profile. Here is a chart from the Carplus report shows that car club membership is strong amongst younger drivers which is always interesting. I wonder what the demographic profile of people buying electric cars is?

Car club membership by age

So… personally, if I was the new Transport Secretary I would not want to be sitting where Philip Hammond is sitting in the picture below taken in July 2011. I would pushing for money to be spent on supporting car clubs and would be resisting the road building and motoring lobby. If I was the RAC Foundation, or to give them their full title of ‘Royal Automobile Club Foundation for Motoring Limited’ I would be worrying that it was all going horribly wrong.

Hammond in electric car

20 mph proposals in Edinburgh and road safety

13 Nov

Edinburgh is proposing a significant increase in the number of streets covered by 20mph. This is being promoted as a way to encourage waking and cycling and to improve road safety. It has been reported that they also support the scheme because ‘lower speeds make people feel safer when they are walking and cycling and make streets better places to live’. I am very supportive of 20mph zones, I live in one myself, and they do indeed help make streets feel less intimidating. However.. it is also very clear that 30 mph speed limits are being retained on the roads where most people are getting injured.

Here are three maps to show the compromises being taken between road safety and ‘keeping traffic moving’. The first map shows the proposed streets to be 20 mph (green and yellow) and 30 mph (blue). The second map shows where people have been injured between 2000 and 2010 by mode (blue for pedestrian, red for cyclists, tan/green for vehicle occupant). The final map shows these two superimposed illustrating that very few crashes from the past 10 years have actually occurred on the roads included on the scheme. (Click on maps for full size versions)

Existing 20 mph zones (green) and proposed schemes (yellow)

Location of traffic casualties by mode in Edinburgh 2000-2010

Overlay, traffic casualties 2000-2010 on top of proposed speed limits

One realistic approach for now might be to welcome the introduction of these 20 mph limits in residential areas and also to also press for average speed camera checks on the remaining arterial roads enforcing the 30 mph limit as they have just installed in part of Plymouth.

Mapping pedestrian/cyclist road casualties by age

12 Nov

The Stats19 casualty data that the police have been patiently collecting for many years now is a mine of information. Here are some maps looking at where pedestrians and cyclists are injured and killed depending on their ages. I have taken three places which show up some patterns which deserve more analysis (London, Edinburgh and Northampton). There are some obvious patterns, in that children are hurt in the residential areas, 16-55 year olds tend to be injured in the commercial centres and along the main arterial roads whereas 55+ year olds have their own distinct patterns. However, it is also possible to see tell-tail clusters which deserve more investigation, including the apparent rat-runs along ‘residential’ roads that have much higher levels of injury than surrounding roads, and also the junctions and sections roads where higher numbers of casualties that surrounding ones. Click on the maps to make them bigger and see what you can find.

South London pedestrian and cyclist casualties by age 2000-2010

Edinburgh pedestrian and cyclist casualties by age 2000-2010

Northampton pedestrian and cyclist casualties by age 2000-2010

Lots more mapping coming up on the lead up to World Remembrance Day for Road Traffic Victims on the 20th Nov.

Rembering the dead on London’s roads

12 Nov

Thank you to the hundreds of cyclists who took part in the Tour du danger today to highlight a number of London’s most dangerous junctions and put pressure on the Mayor and on TfL to do some serious work on them.

Here are some maps showing where people are have been getting killed and injured in recent years. The first one shows deaths and injuries from traffic crashes between 2000 and 2010, the second for 2010 only and the next one for 2009 and the final one for 2000. Areas of blue indicate were pedestrians are getting injured and killed, red shows the high risk areas for cyclists. Purple is for motorcyclists and tan/green for vehicle occupants. Click on the images to see them full size.

Road casualties in Central London 2000-2010

Road casualties in Central London 2010

Road casualties in Central London 2009

Road Casualties in Central London 2000

These maps appear to show that fatalities amongst vehicle occupants has fallen from 17 in 2000 to one in 2009 and then zero in 2010. For cyclists the trend is apparently going the other way (up from four in 2000 to eight in 2009 and also in 2010). Motorcyclist fatalities are up from 0 in 2000 to 6 in 2010, pedestrians falling significantly. Do however be aware that this map only shows one fatality blob for crashes with multiple fatalities (which may include multiple modes). I will do some more work on this in the coming week and the figures may then need to be adjusted upwards.

Based on Stats19 road casualty data. See ‘Reported Road Casualties Great Britain‘ for more details.

Attacking the A40 bus lane in High Wycombe

17 Oct

Having abolished the M4 bus lane some hard-line motorists are now gunning for getting rid of bus lanes and are regretably even getting the support of local papers. A great example of this sort of thing is the campaign to get rid of the bus lane along the A40 into High Wycombe is now being championed by the Bucks Free Press who have created a ‘ban the bus lane’ petition to support their ’cause’.

The advocates of removing the bus lane say that it is dangerous and slows motorists – the council patiently explains that removing the bus lane will not increase the number of vehicles able to get into the town and will only result in slower journeys because of bus passengers switching to cars. The bus company point out that the lane is well used by buses and that they are about to increase the level of service with new buses.

Here are some maps showing what is going on (all taken from official data). The first one shows bus service frequency on roads in the area (yellow most frequent) and confirms that there are many bus services along the A40 from Loudwater in the bottomm right of the map into High Wycombe at the top left. The second one shows traffic counts and traffic mix in the area in 2008 – the small yellow dot on the A40 towards the bottom right indicates that over 85% of the vehicles using that road are private cars or taxis. This confirms that the problem of congestion on the road is from cars not buses!

Bus service frequency on A40 into High Wycombe

Traffic counts and traffic mix around High Wycombe

One of the reasons given for removing the bus lane is because ‘it is an accident waiting to happen’. Here are the actually accident results since 1985 on the road (big red dots a pedestrian fatality, small red dot a pedestrian serious injury, big blue dot for a driver fatality and a small blue dot for a driver serious injury). There have regrettably been six of pedestrian fatalities and two driver fatalities and also a number of driver serious injuries (how fast do you have to be traveling in a car in an urban area to have a serious injury I wonder)! Possibly this is a good reason to slower well-enforced speed limits rather than the removal of a bus lane?

The final map shows where the schools are and where the kids live. As you can see most of the kids have to cross the A40 road to get to school each day.

Fatalities and serious injuries on the A40 approach to High Wycombe

The location of school and school-age kids to the SE of High Wycombe

All maps produced by the pre-release version of ITO Map. Base mapping OpenStreetMap and contributors. All maps cc-by-sa 3.0.

RIP school travel mode statistics – burying bad news?

1 Sep

Ministers have just announced that there will be no ‘travel mode’ question in the next school census. I find this curious because the school run is a hugely challenging and emotive subject for parents and for other car commuters. Here are a couple of charts showing who how things have changed over the past 15 years during which time this information has been collected. Notice that more primary age kids will be traveling to school by car than on foot soon if current trends continue, also that the car and local bus is gaining with secondary school age kids at the expense of waking. Cycling is lost in the noise at the bottom.  I wonder if the parents at these Brentwood schools parents will start chucking rocks at traffic wardens again? Was it relevant, per-chance that these statics were first collected in 1995 just after the previous conservative government abandoned the ‘great car economy’ following an epidemic of road protests in the 1990s? (walking is dark blue and is highest for both groups, cars are in yellow and are next highest for primary school kids and have similar percentage as for local buses for secondary school kids. Local buses are in dark purple).

Travel to school by mode of transport (1995-2010)

Young men and fast cars – a thing of the past?

28 Aug

Exploring the idea of ‘peak car‘ a little further, here is a chart showing the percentage of people with full driving licences by age and how this has changed over time. It seems that driving is morphing from something that younger people do to one that older people do and from a male thing to a much more gender-neutral thing. Notice how the percentage of 17-20 and 20-30 year olds has fallen since the mid 1990s and how the number of 50-60, 60-70 and 70+ year olds has been rising steadily; the percentage of people 60-70 year olds overtook the percentage of 20-30 year olds in 2001 and the 70+ year olds are about to do the same.

The two smaller charts break this data down by gender. The percentage of 70+ men overtook 20-30 men in about 2003. The percentage of women with driving licenses grew fast from a much lower base in 1975 getting much closer to parity with men over time. The recent decline in licences held by younger women has been less pronounced than for younger men. Source data from the Department for Transport.

Regional trends in car owership

26 Aug

Here are an interesting set of charts created from data published by the DfT showing car ownership levels in each of 11 areas making up GB (the nine English regions together with Scotland and Wales). These figures have been adjusted to changing populations within each region. What is interesting is to see how some areas with high ownership levels already are continuing to add more every year (South East and South West for example),but that levels are much more stable in the East of England and West Midlands with percentages decreasing significantly in London and in the North West. Is this an effect of the recession, of regional economic issues or ‘peak car‘? I suspect that all of these issues are relevant to different degrees in different places. The total increase in registered vehicles in the period 2000 and 2010 for Great Britain was an impressive 4,015,328 units or of which have had to go somewhere, mainly in the south it seems.

Car ownership levels 2000-2010

Update

I have updated the above chart to include population changes within the period using this data.